IrelandOffline Quarterly Report Q4 2011
IrelandOffline Quarterly Report Q4 2011
The latest Irelandoffline Quarterly report, based as always on Ookla Netindex Data shows Broadband Speeds in Ireland are worse than ever. Ireland has dropped to 53rd place with an average download speed of 7.86 Mbps. Ireland has plunged a catastrophic eight places in the download world rankings in this quarter alone.
This dismal performance rating leaves us behind many Internet luminaries such as Moldova,Vietnam, Mongolia ,Papua New Guinea, Ghana and Kyrgyzstan.
Poor performance is disappointingly accompanied by misleading advertising and high prices.
Ireland is the 5th worst in Europe for under-performance against service promise and the 3rd most expensive in Europe in the service cost per Megabit per second.
In Quarter 4 2011 Ireland’s Position is as follows:
Ireland is 53rd in the World for Download Speeds and 24th out of 27 in the EU (45th/24th Q3 2011)
Ireland is 71st in the World for Upload Speed and 24th out of 27 in the EU (72nd/24th Q3 2011)
Ireland is 23rd in the World up for Quality and 18th of *25* in the EU (24th/18th Q3 2011
Ireland is 53rd in the World for Promise and 23 out of 27 in the EU (45th/24th Q3 2011)
Ireland is 43rd in the World in cost per Mbps and 25 out of 27 in the EU (New)
IrelandOffline notes that since our new Minister for Communications Pat Rabbitte assumed office in late Q1 2011 the improvements to Ireland’s Broadband Performance rapidly levelled off and our performance has now gone into full reverse with a drop of eight places in download speeds during the past quarter. We feel that Minister Rabbitte has had quite long enough, nine months in fact, to learn his Departmental ‘Excuse Book’ off by heart and now the necessity for strong action is required to stem our inevitable slide.
In our Q3 Report, Irelandoffline observed that ”This improvement in cable broadband speeds keeps Ireland largely static in the international tables instead of falling back as expected.”
These improvements have largely tailed off, the limited launch of eircom Fibre to the Home and to the Kerb Products during the past quarter had no measurable effect on eircom performance and we are falling down the rankings again simply because competitor nations continue to systematically invest and improve as compared to the mess Minister Rabbitte presides over.
The Urban Rural divide as implied by the gap between UPC and eircom continues to grow. The average UPC customer enjoyed three times the speed of the average eircom customer in Q4 2010 and the performance gap in Q4 2011 now shows UPC is on average over four times faster than eircom.. This improvement in cable broadband speeds kept Ireland largely static in the international tables over much of the year but can no longer deliver a sufficient performance to keep us static in International Comparison tables.
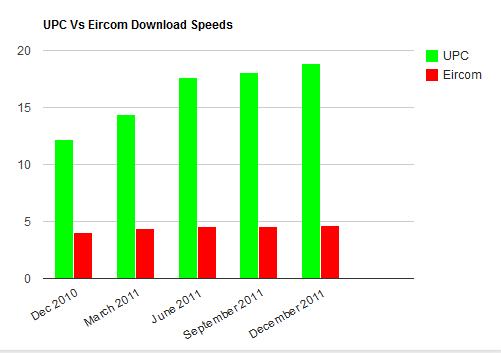
Table of Download Speeds ( in Mbits) UPC vs Eircom
UPC Eircom UPC/Eircom Ratio
Dec 2010 12.21 4.01 3.04
Mar 2011 14.4 4.4 3.27
June 2011 17.62 4.59 3.84
Sept 2011 18.11 4.57 3.96
Dec 2011 18.84 4.66 4.04
Recently cabled towns, typically towns with populations between 10,000 and 30,000 are now vastly outperforming our main cities which are the main employment centres. UPC cable is largely confined to residential areas rather than core employment centres in the cities.
The fastest speeds in Ireland are in Dungarvan County Waterford where the local cable ISP, Casey Cablevision (not measured), now deliver average speeds of 23.09mbits. In second place nationally is Athlone on 17.48 mbits and Swords Co. Dublin has dropped to from second place in Q3 to third in Q4 on 15.12 mbits.
The top 10 Towns have an average speed of 13.16mbits in Q4 up from 12.64mbits in Q3 2011
Ireland’s top ten cities/towns and download speeds
1 Athlone 17.48 Mbps
2 Swords 15.12 Mbps
3 Celbridge 14.12 Mbps
4 Waterford 13.60 Mbps
5 Clonmel 12.35 Mbps
6 Lucan 12.24 Mbps
7 Greystones 11.89 Mbps
8 Maynooth 11.78 Mbps
9 Tallaght 11.62 Mbps
10 Mullingar 11.11 Mbps
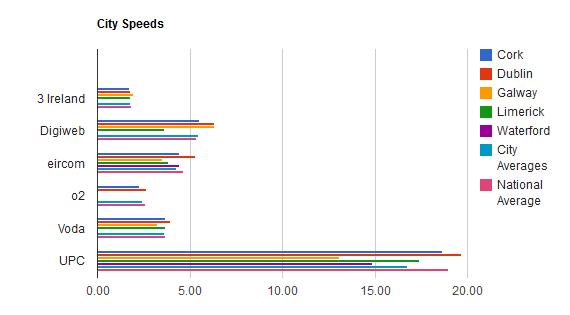
As ever none of the big Cities are in the top 10. Dublin is in 13th place on 9.54mbits and Cork is in 20th place on 8.33mbits in Q4. Dublin has nevertheless dropped to 13th fastest overall in Q4 from 12th fastest in Q3.
Average eircom speeds in Dublin and Cork all increased but average UPC speeds increased by a notably greater amount.
Table Showing Operator Speeds In The Main Cities, Q4 2011.
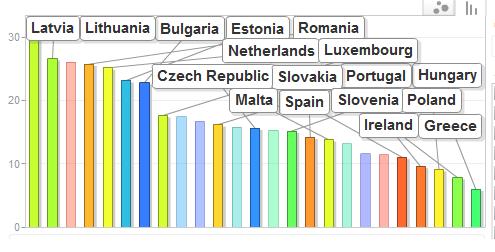
EU Download Speeds Q4 2011.
EU Upload Speeds Q4 2011
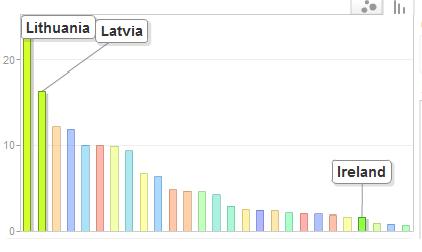
EU Download Speed Performance Gap
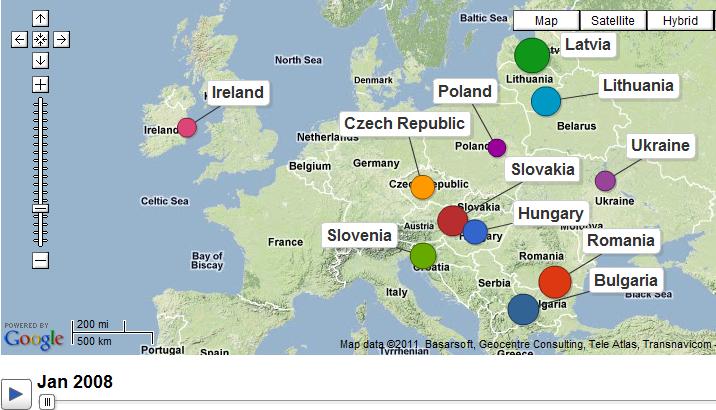
Google Netindex Visualisation (Select Download Speeds) January 2008 (Source)
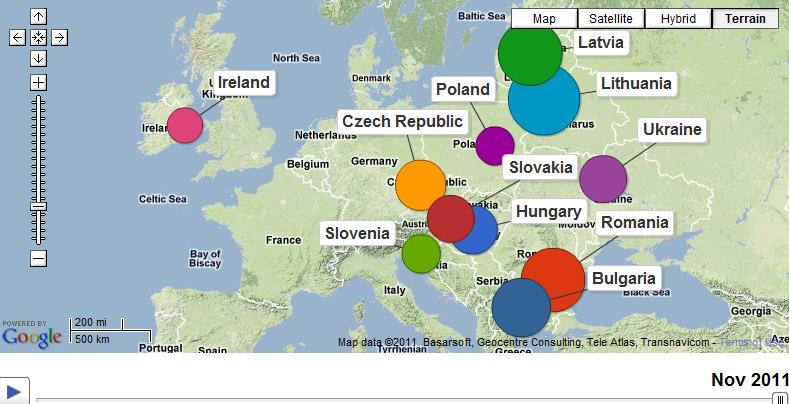
Google Netindex Visualisation (Select Download Speeds) November 2011 (Source)
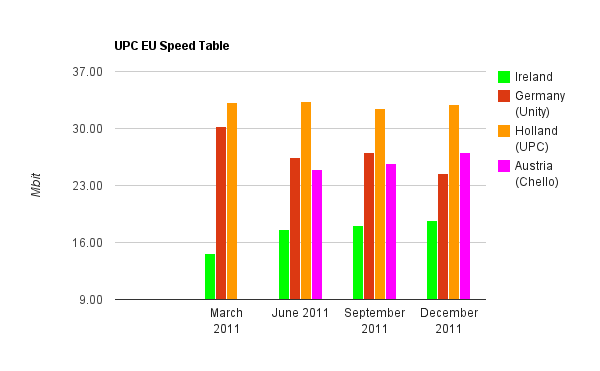
UPC Speed Comparison.
While UPC speeds continue to rise in Ireland they are also rising in other UPC Territories in the EU. UPC Ireland is much slower than UPC in Holland Germany and Austria.
Notes:
Click on an INDIVIDUAL country inside a listing for City and ISP Statistical Drilldowns.
Download Index http://www.netindex.com/download/
World (All Countries) http://www.netindex.com/download/allcountries/
EU http://www.netindex.com/download/1,7/EU/
Town and City Speeds http://www.netindex.com/download/2,49/Ireland/
Upload Index http://www.netindex.com/upload/allcountries/
Quality Index http://www.netindex.com/quality/allcountries/
Promise Index http://www.netindex.com/promise/allcountries/
Click HERE To get a Visualisation (press play button to see the last 3 years)
1 Response
[…] […]